Founded in 1996 and registered with the Securities and Exchange Board of India as a market infrastructure institution, NSDL provides core services such as demat account maintenance, transaction settlements, record-keeping, and corporate actions.
It also has two key subsidiaries. NSDL Payments Bank focuses on business-to-business and financial inclusion services, and NSDL Database Management Ltd offers e-governance, customer verification or know-your-customer (KYC), and insurance repository services. NSDL Database also runs SEZ Online for transactions related to special economic zones, which are tax-free and export-focused enclaves.
As of March, NSDL serviced 99.99% of foreign portfolio investor (FPI) assets in demat form and held 86.8% of the country’stotal demat value. Its reach spans 99.34% of Indian pin codes and 194 countries.
Yet, even as NSDL remains a critical cog in India’s capital market machinery, it is confronting a shifting landscape—marked by rapid retailparticipation, fintech disruption, and increasing competition from its younger rival, Central Depository Services (India) Ltd (CDSL).
Revenue streams
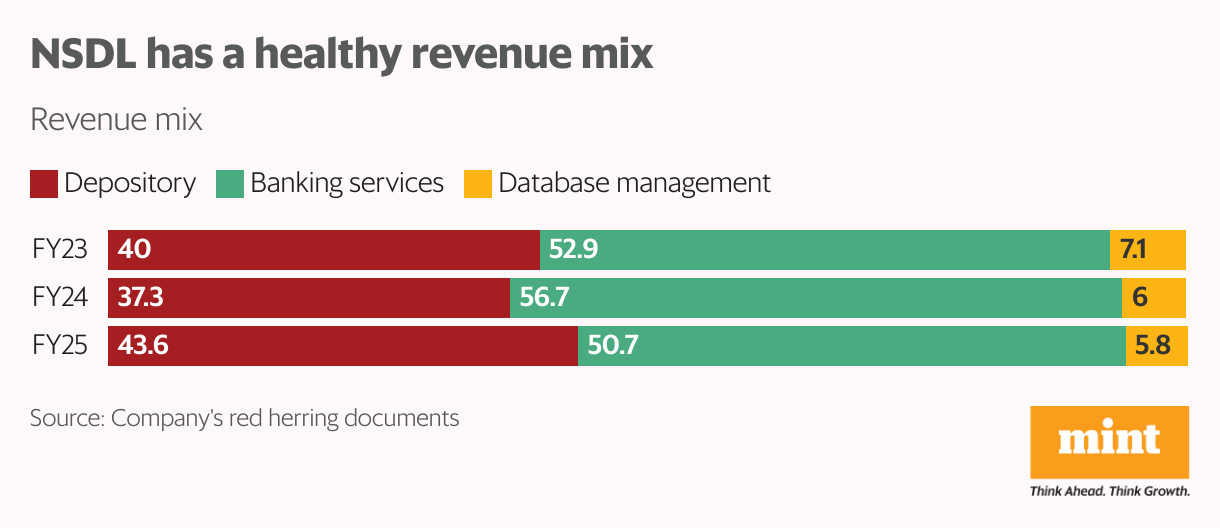
In 2024-25, NSDL posted consolidated revenue of ₹1,420.1 crore. Of this, banking services contributed ₹719.9 crore, or 50.7%, depository services accounted for ₹618.6 crore, or 43.6%, and database management services added ₹81.6 crore, or 5.75%.
NSDL’s profitability is skewed heavily towards its core depository services function, which contributed ₹310.6 crore, or 91.3% of total profit. Banking brought in just ₹3.66 crore (1.08%).
“While a significant portion of NSDL’s revenue comes from its payments bank services, this contributes negligibly to overall profitability due to thin margins (about 0.5%) and high operating costs,” said Ranjit Jha, managing director and chief executive officer, Rurash Financials.
Despite the lopsided profit mix, the business model offers resilience.
“NSDL posted strong growth, driven by operating leverage and a stable, annuity-like revenue model largely from recurring custody and depository participant fees,” said Sunny Agrawal, head of fundamental equity research at SBICAPS Securities. “This provides insulation from market volatility. It also earns from software licensing and RTA (registrar and transfer agent) services.”
Institutional stronghold
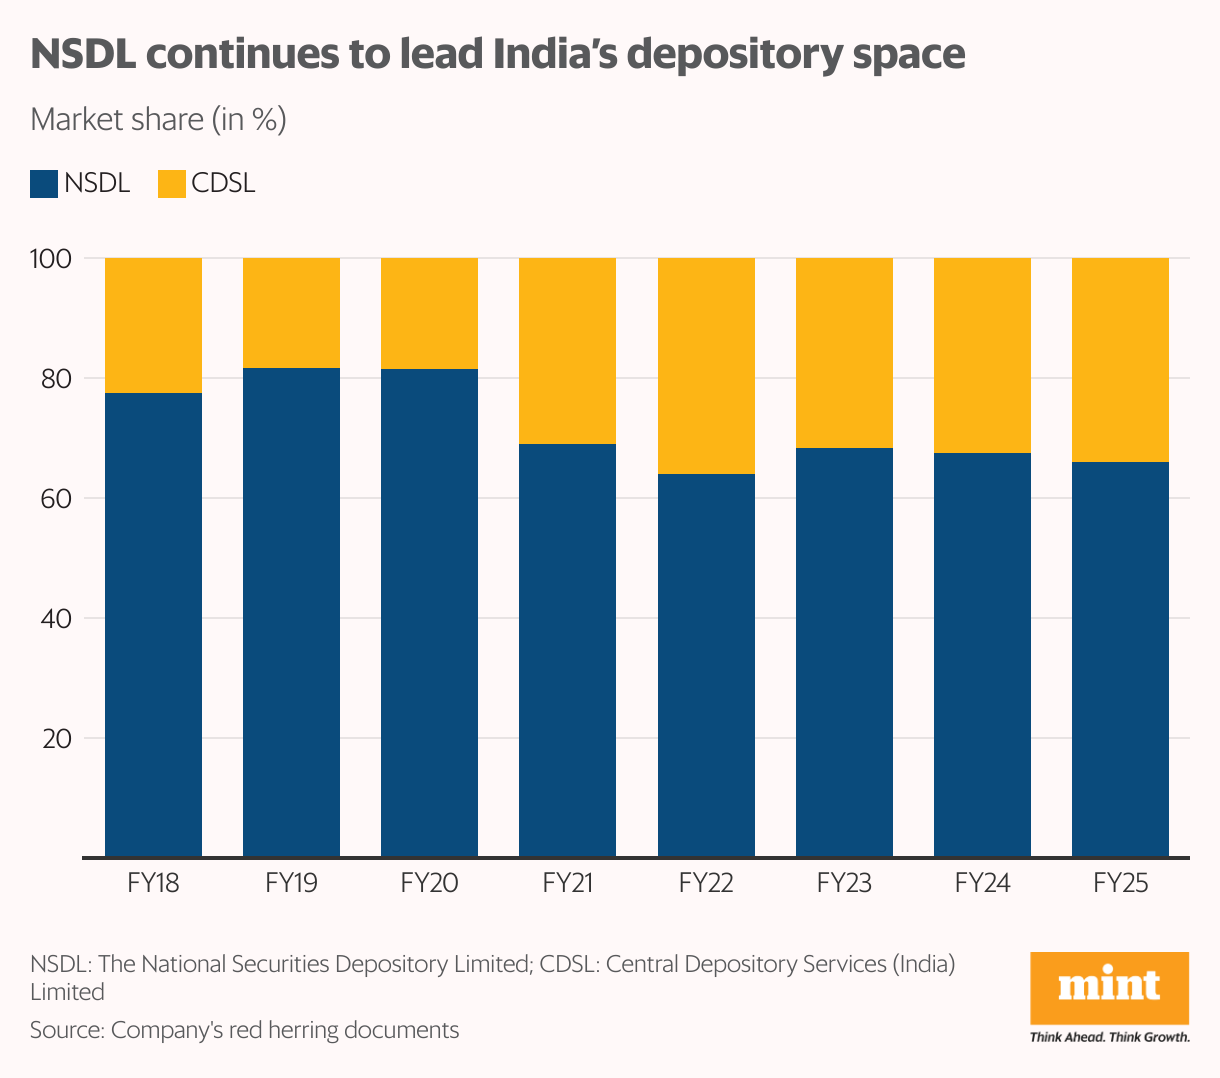
Over the years, NSDL has maintained a dominant market share in terms of the value of shares held in demat accounts. In FY25, it settled ₹103.2 trillion worth of securities, translating to a 66.03% market share.
CDSL, in comparison, handled ₹53.1 trillion with a 33.97% share.
NSDL’s strategic focus on serving large investors and FPIs has ensured its stronghold, although its peak 81% market share in FY19-20 has slipped to 66%.
“For NSDL, it’s value over volume,” said Vaqarjaved Khan, senior fundamental analyst at broking firmAngel One. “It serves institutional clients such as mutual funds, insurers, and government entities. The company is expected to invest over ₹100 crore in FY26 intech upgrades, targeting deeper penetration into areas like NPS (national pension system), ETFs (exchange traded funds), debt, and unlisted assets.”
Jha added that the different trajectories of NSDL and CDSL are more about strategy than efficiency. “NSDL targets institutions, while CDSL focuses on retail and discount brokers. Both models cater to different segments and work in parallel,” he said.
Valuation: A reasonable ask
NSDL’s IPO comes at a relatively reasonable valuation compared to its listed peer. At the upper end of the price band, NSDL’s price-to-earnings ratio stands at 46.6x for FY25, down from 58.1x in FY24 and 68.1x in FY23.
CDSL, by contrast, trades at 68x earnings, making NSDL’s IPO more attractively priced for long-term investors seeking exposure to digital financial infrastructure.
“IPO valuation on FY25 earnings appears fair given limited competition, a structural moat, and a high-value institutional client base,” said Khan. “Over the long run, value creation will depend on tech adoption, scalability, and diversification into other institutional products.”
NSDL vs CDSL
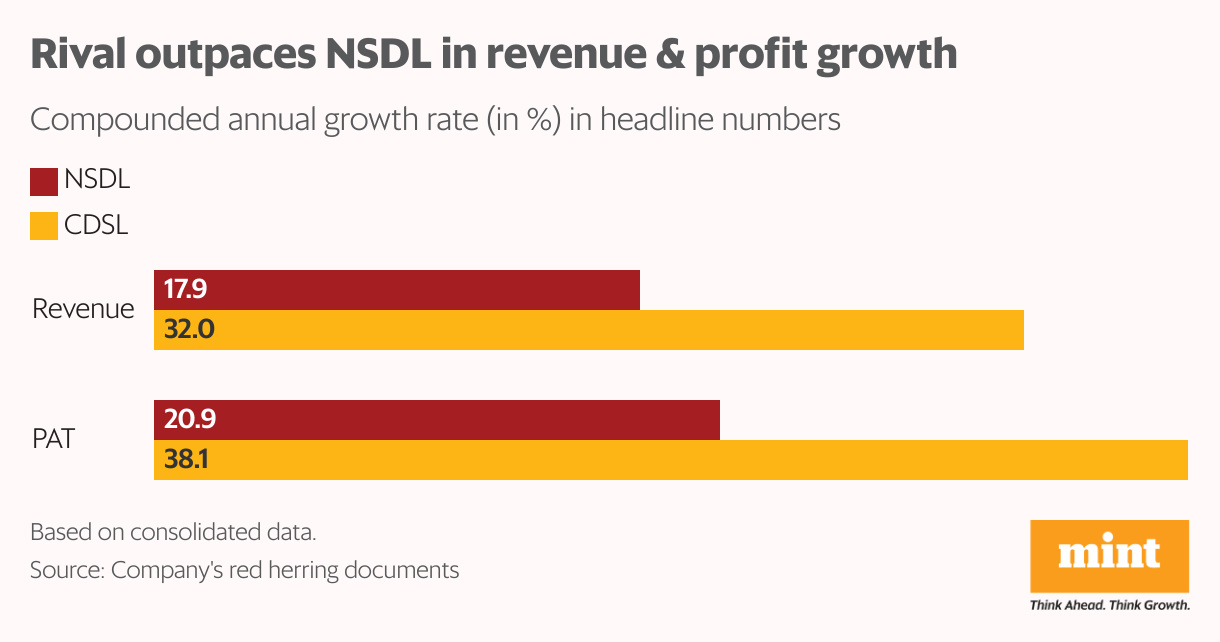
Still, the growth differential is noteworthy. Over the previous three fiscal years, NSDL’s revenue has expanded at a compound annual growth rate of 17.9% and its net profit at a CAGR of 20.9%. CDSL’s revenue expanded at a CAGR of 32.02% and its profit at 38.10% over the same period.
“While CDSL has more demat accounts, it doesn’t imply a more efficient model. Both depositories operate similarly, offering demat, transaction, and record-keeping services,” said Jha.
“The key difference is their client base—CDSL caters to retail and discount brokers, leading to high volumes but lower custody per account, while NSDL serves institutions, resulting in fewer accounts but higher custody value and profitability. The variance stems from target segments, not structural efficiency,” he added.
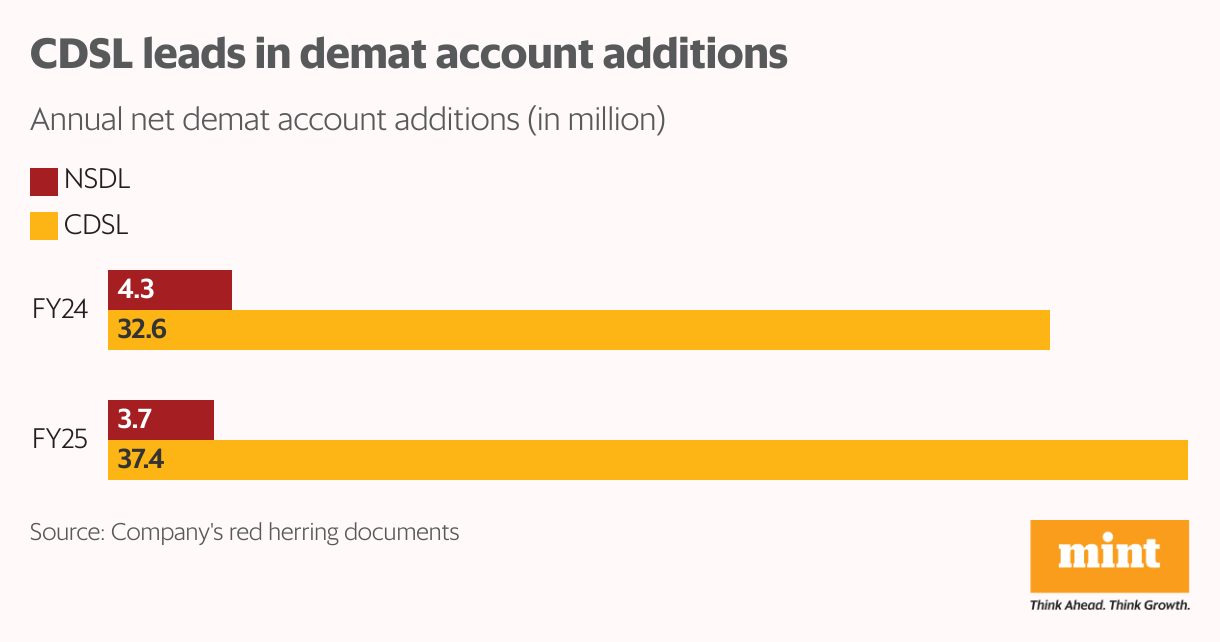
CDSL added 32.61 million accounts in FY24 and 37.37 million in FY25. NSDL added only 4.31 million and 3.68 million, respectively, in FY24 and FY25. CDSL’s success stems from early fintech integrations with digital broking platforms Zerodha, Groww, and Upstox.
“CDSL’s lead in retail is driven by a cost-effective model and early integration with fintech platforms,” said Agrawal of SBICAPS Securities.
NSDL, however, is now making up for lost time, accelerating fintech tie-ups, onboarding retail clients through platforms like CCAvenue and Spice Money, and adding over 9,000 demat accounts daily, he added.
However, regaining its market share will require more than just current initiatives.
“To regain the lost market share to the competition, NSDL needs to strategize their business focus on the retail segment. This can be done by increasing their engagement with new-age fintech brokers and introducing a new pricing model tailor-made to appeal to the fintech brokers. However, this depends on the strategic plan the depository would like to adopt to regain retail market share,” said Jha.
Opportunities in a growing market
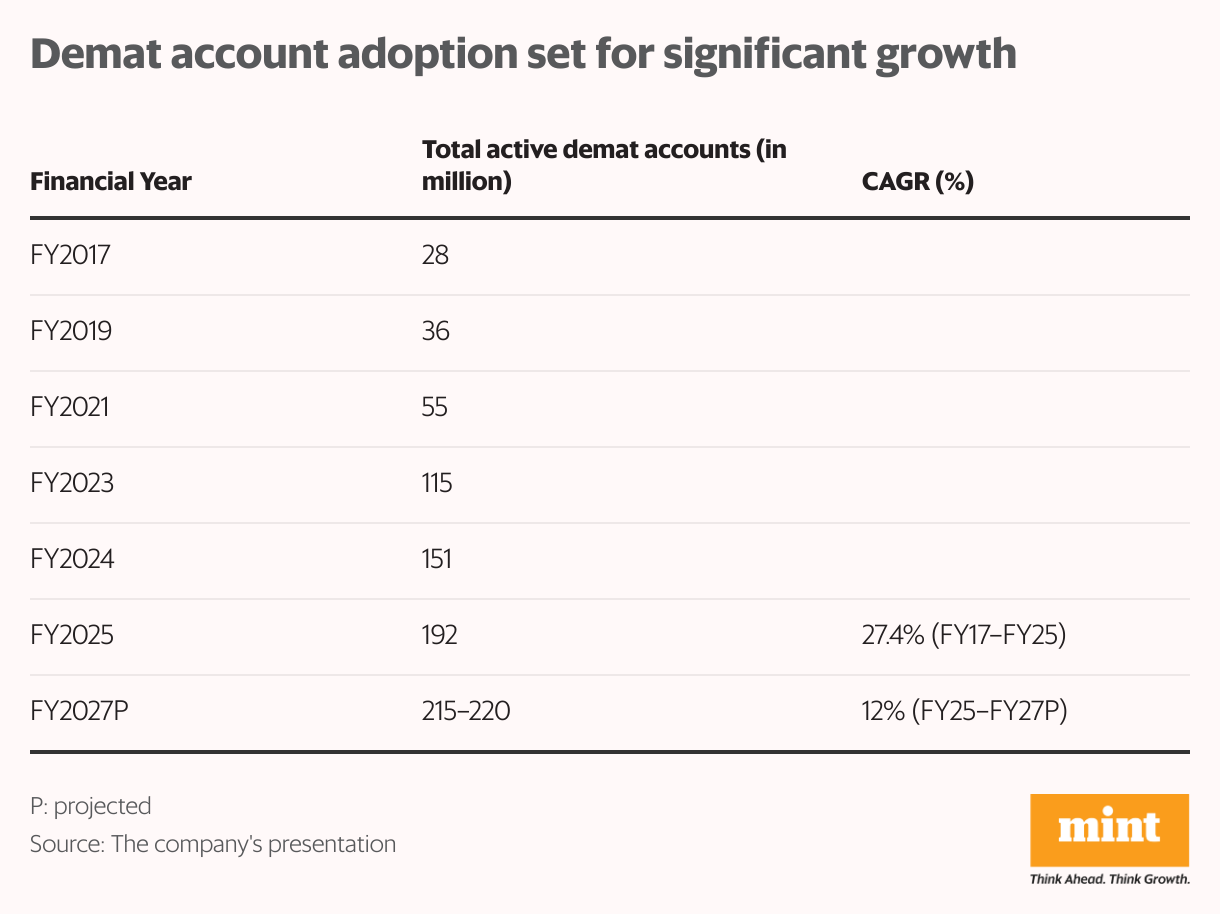
The underlying market opportunity remains strong. India’s demat account base grew from about 28 million in FY17 to 192 million in FY25, clocking a robust CAGR of 27.4%.
While the pace may slow to an estimated 12% CAGR through FY27—taking the total to about 220 million—the structural trend remains intact: a deepening equity culture, greater retail participation, and rising financial literacy.